9 Ways to Use Google Analytics to Improve Your Business
 The odds are good that if you are a regular reader of these pages that you know what Google Analytics is. If you don’t, you are either very new to the Internet marketing world or you have been running your business from a cave somewhere for the past 10 years or so.
The thing is, while most of us know about Google Analytics and many of us even have an account with them (some even go so far as to join Bing Analytics though it’s still a very distant second to the Google behemoth), few of us really know how to use the service to our advantage from a business perspective. Most of us just glance at the statistics once in a long while (if at all) then shrug.
Here are 9 ways to make Google Analytics work harder for your business so that you can do what you set out to do – make more money online:
Set Some Goals
In essence, goals are designed to allow you to track whether or not your website is doing what you want it to do. So for example, you might set up a goal which allows you to track for a specific number of visits or a specific duration of visits to your site.
Your goals can have four basic types of criteria. You can simply choose that you want a specific number of people to visit a specific portion of your site (so for example if you run an online store, a goal might be a specific number of people visiting the checkout page).
You can also choose to track visit duration. This is important because it will tell you how long people spent visiting your website. Typically, the longer the average visit, the better you are communicating to your customers.
Bounce rate is another important goal option. This is how often someone drops by, reads what you have there and then leaves to go elsewhere. I found for example by setting up goals that while I’m getting customers to stay engaged with my site (they spent a significant amount of time there), they also tend to read the one article they found through a search and then move on to somewhere else.
Finally, you can track events, for example how often they clicked on a particular link on your site.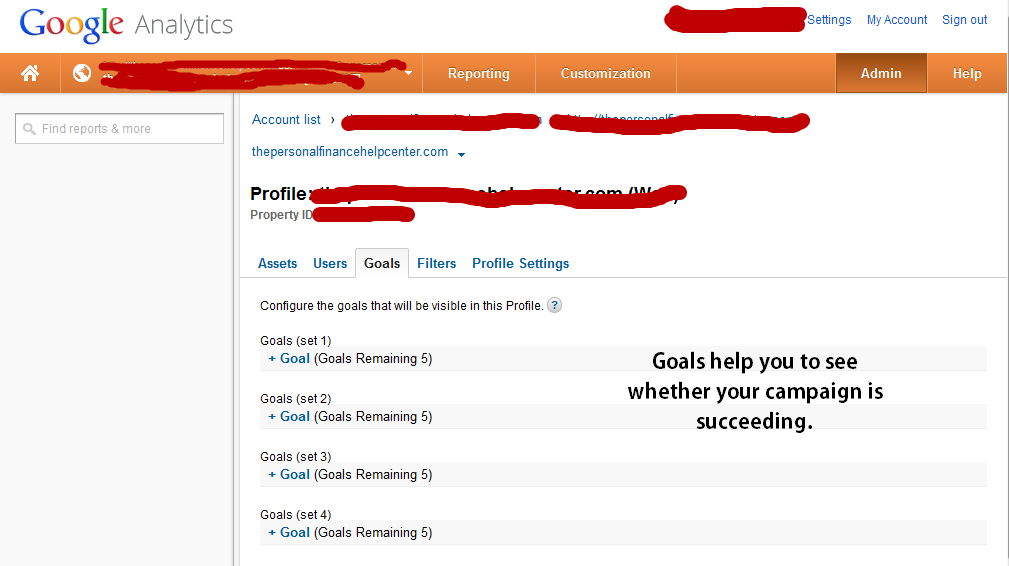
While you can of course track all this on your own, the fact that Google allows you to track it automatically means that it’s easier to visually see whether or not you are getting where you want to get with your site.
Link to Webmaster Tools
Another oft forgotten feature of Google Analytics is that it can also display information from your Google Webmaster Tools account. To be totally honest, I’ve never understood why exactly Analytics and Webmaster Tools are separate. Webmaster Tools allows you to check information about how well your site is doing in the search results on Google.
You can find information there about the number of times your site shows up in search results, where in the results it shows up and even diagnostic information that Google’s web crawler prepares when it searches your site for additional content.
Another nice feature at Webmaster Tools is the ability to check how many people have +1ned your website. Finally, you will also be able to see some additional search engine optimization reports offered directly by Google. For example, you can find out:
Which keywords are getting lots of impressions of your site but not that many clicks so that you can try to tweak your descriptions to get people to click them more often.
Which pages have great click through rates but poor rankings in Google, meaning that you need to do more link building to push them up in the SERPs.
Get Your Site Speed Reports
Site Speed is another great feature that is offered by the kind folks at Google. In essence, site speed tests how long it takes your website to load up with a variety of different popular browsers. The faster your site loads, the more likely people are to stick around and actually see what you have to tell them.
I found out when I glanced at Site Speed for example that IE users are having a very bad experience when visiting my website while Chrome users see it load up reasonably fast. I’ll need to do some investigations to figure out why the speed is so different between different browsers but armed with this knowledge, I can potentially improve the user experience and as a result increase the number of customers.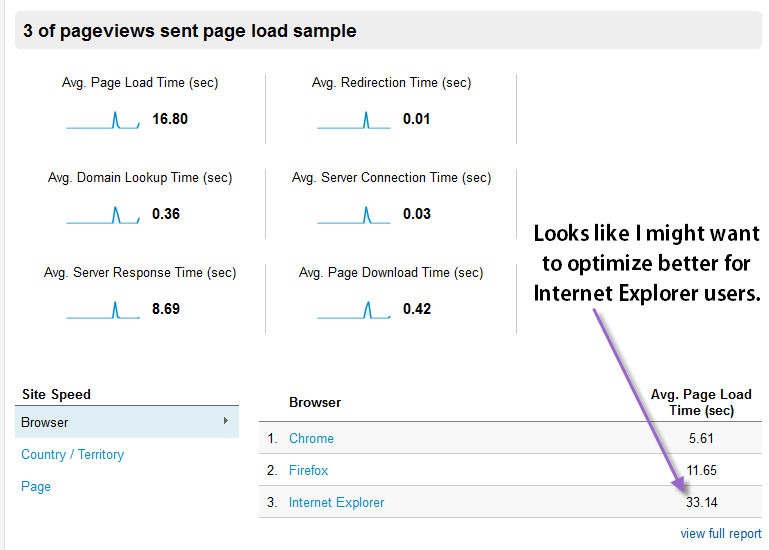
A look at the Map Overlay section of the Site Speed Report can also tell you how long it’s taking your customers in various parts of the world to access your site and how many customers are in fact doing so from each country.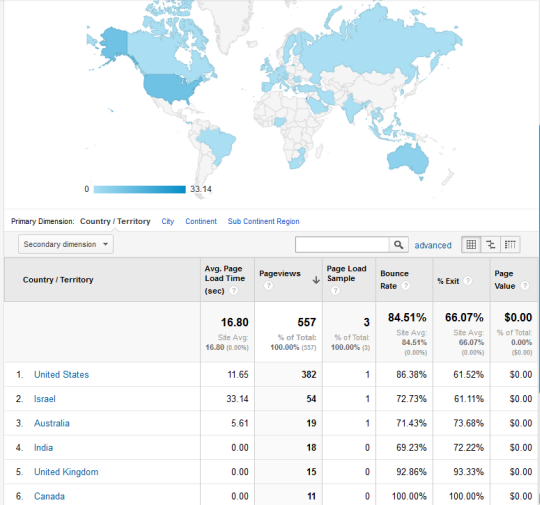
Check Site Search
One of the many nice features offered by Google to site owners is a custom search engine which allows people to search through your website to find information they need on it. This can be especially important when you have an ecommerce site but even an ordinary blog can benefit greatly from this kind of feature.
You can set up a custom search bar on your site relatively easily by inserting a bit of code into the header or sidebar of your website. This allows you to potentially keep many more visitors engaged with your site and as such, hopefully purchasing whatever it is that you sell there. By tracking how many people used your site’s search bar in Google Analytics, you can see how engaged your visitors actually are.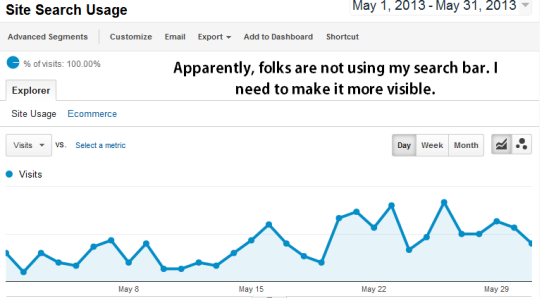
Event Tracking
You may recall that I mentioned in the goals section that it is possible to track events in Google Analytics. In essence, events can be anything your customers do on your website. You can track how often they visit the checkout page, how often they download your free guide, how often specific ads are clicked and even how often and how a video gets looked at.
In short, event tracking allows you to see pretty much everything that your customers do as they interact with your website and see how often it happens. This is very valuable information because it can allow you to tweak your site and see if you can improve the numbers for specific events (i.e. for the number of times people get to your checkout page or even finish checking out).
It is also possible to track how often they get an error message when they get to your checkout page by the way which is vital to ensuring that you get the maximum number of possible customers for your products. You can find instructions for event tracking on Google’s website.
It’s really not that difficult so don’t let the bit of coding required get you too nervous. However, if you feel you can’t do it, try hiring a pro to handle it. Since this is a very simple job, you could likely even post a gig request on Fiverr to have the job done.
Multiple Sources for Referrals
Google refers to this as “multi-channel funnels” but I think that’s a bit of a confusing name for this feature. Regardless of what they call it though, this is a very awesome tool which you should be using to track your customers. In essence, the multi-channel funnels feature allows you to see all the different ways that a particular visitor was referred to your website.
Say for example that you have a customer whom you know was referred to your website from your Twitter feed. From there, they proceeded to purchase whatever product you have for sale. Okay, so you know that the Twitter feed got you a sale. However, in reality, it’s not so simple. Most people don’t make a purchase the first time they visit your website.
I have seen various estimates but often it takes as many as seven visits before a potential customer will make a purchase. This is one reason that AdWords allows you to track a visitor – by tracking them and allowing them to be reminded of what they previously looked at, you are likely to get repeat visits and ultimately, a sale.
The multi-channel funnels feature (and again, I think multiple source referrals is a better term but whatever) allows you to see the entire progression that a customer took in order to make their purchase from you. So you might then learn that they first found you in a search. Then they decided to subscribe to your Twitter feed, then made a purchase. Heck, they might even have a few other steps in between.
By seeing the entire sales funnel instead of just the final piece of the puzzle, you are better able to evaluate which features are more valuable (and thus worth investing in) and which ones are not so valuable (and thus worth dropping or at least cutting down on). Google has an excellent YouTube video which explains how this works and how to implement it.
Check Your AdWords Stats
Yet another great feature in Google Analytics is the ability to break out information based on where people came from when they visited your website. This means for example that it is possible to track what happened when people visited from a search engine or when they visited from an AdWords campaign.
This is especially valuable information because you want to ensure that the people coming from Adwords are more likely to be those making actual purchases instead of just dropping by for freebies (you do pay for Adwords after all). You will need to link up your Adwords and Analytics accounts to make this happen.
To be honest by the way, I often wonder why Google insists on asking you to manually link up all these different accounts. They can all run under a single user name (I have all my Google services under my personal Gmail account even though some are purely business and some are personal use only) but I guess one could create multiple accounts for tracking purposes…
Real-time Reporting
Real time reporting on Google Analytics is great because you can see from moment to moment what’s happening on your website. You’ll be able to see how many people are visiting, from where they are visiting, which page they are looking at and how long they spend on the site.
While you could of course see all this information by checking past statistics, seeing it in real time means being able to better gauge how your customers interact with your site and what they are doing on it at any given time. You can find real time reports by clicking on the Real time reporting link on the left side of your Google Analytics dashboard.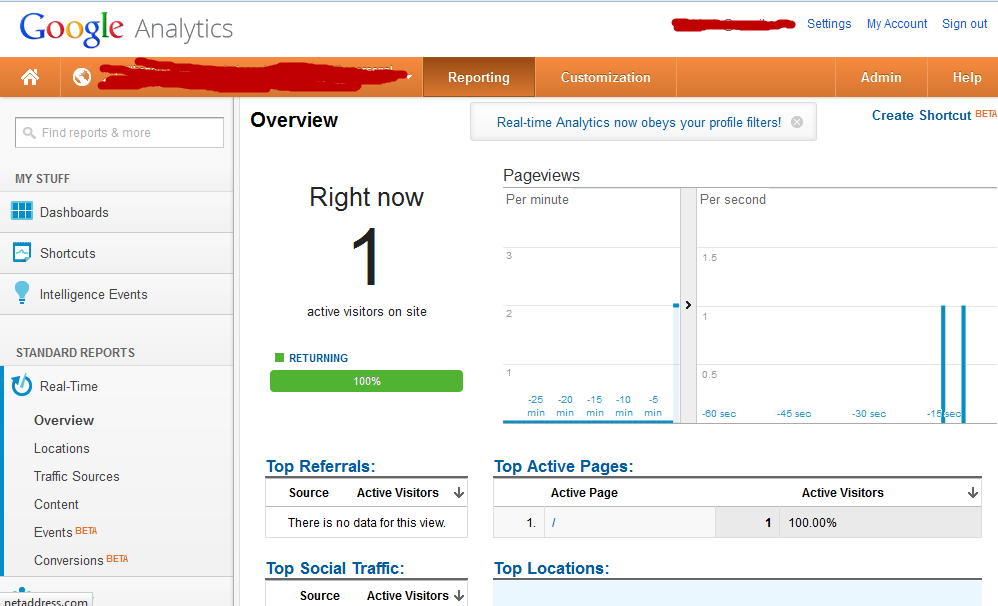
Speaking of Dashboards
Finally, speaking of dashboards, they can be customized with whatever information you feel is most relevant to your own needs. This means for example that you can see your real time statistics alongside the stats for the past month, year or since the site was created. You can add up to 20 different custom dashboards to Analytics by clicking on customize dashboard.
You can then choose from either a totally customized dashboard or using one of the presets that Google offers and then tweaking it to your own needs.
Bottom Line
Google Analytics is one of the most powerful tools that any Internet marketer has at his or her disposal. It is an absolutely vital tool and one that too few of us fully utilize (I include myself in that category by the way). Feel free to share below your own tips and tricks for making the most of Analytics.

